
The economic trends for 2023 already seem to be well signposted: inflation, interest rate rises, talk of QT (Quantitative Tightening – Governments reducing money supply through management of borrowing and bonds).
Yesterday I ran a finance training session for a property and construction group. On their minds were the importance of tenants paying rent on time, an ensuring construction projects are completed with sub-contractors staying financially afloat.
The discussion, including some case studies, went through the rise of debt finance over the last 10-15 years, caused by and connected to the record low interest rates. But ‘easy money’ is so last year.
When analysing balance sheets, I encourage you to have a look at gearing – the ratio of debt to equity. The higher it is, the more debt and the greater financial risk.
For US connected businesses, leverage is more commonly referred to, which work similarly, though measured differently – the multiple of Debt to EBITDA*, with a 4x multiple seen as being ‘high’.
When higher multiples are identified, I encourage you to look at one further indicator – Interest Cover.
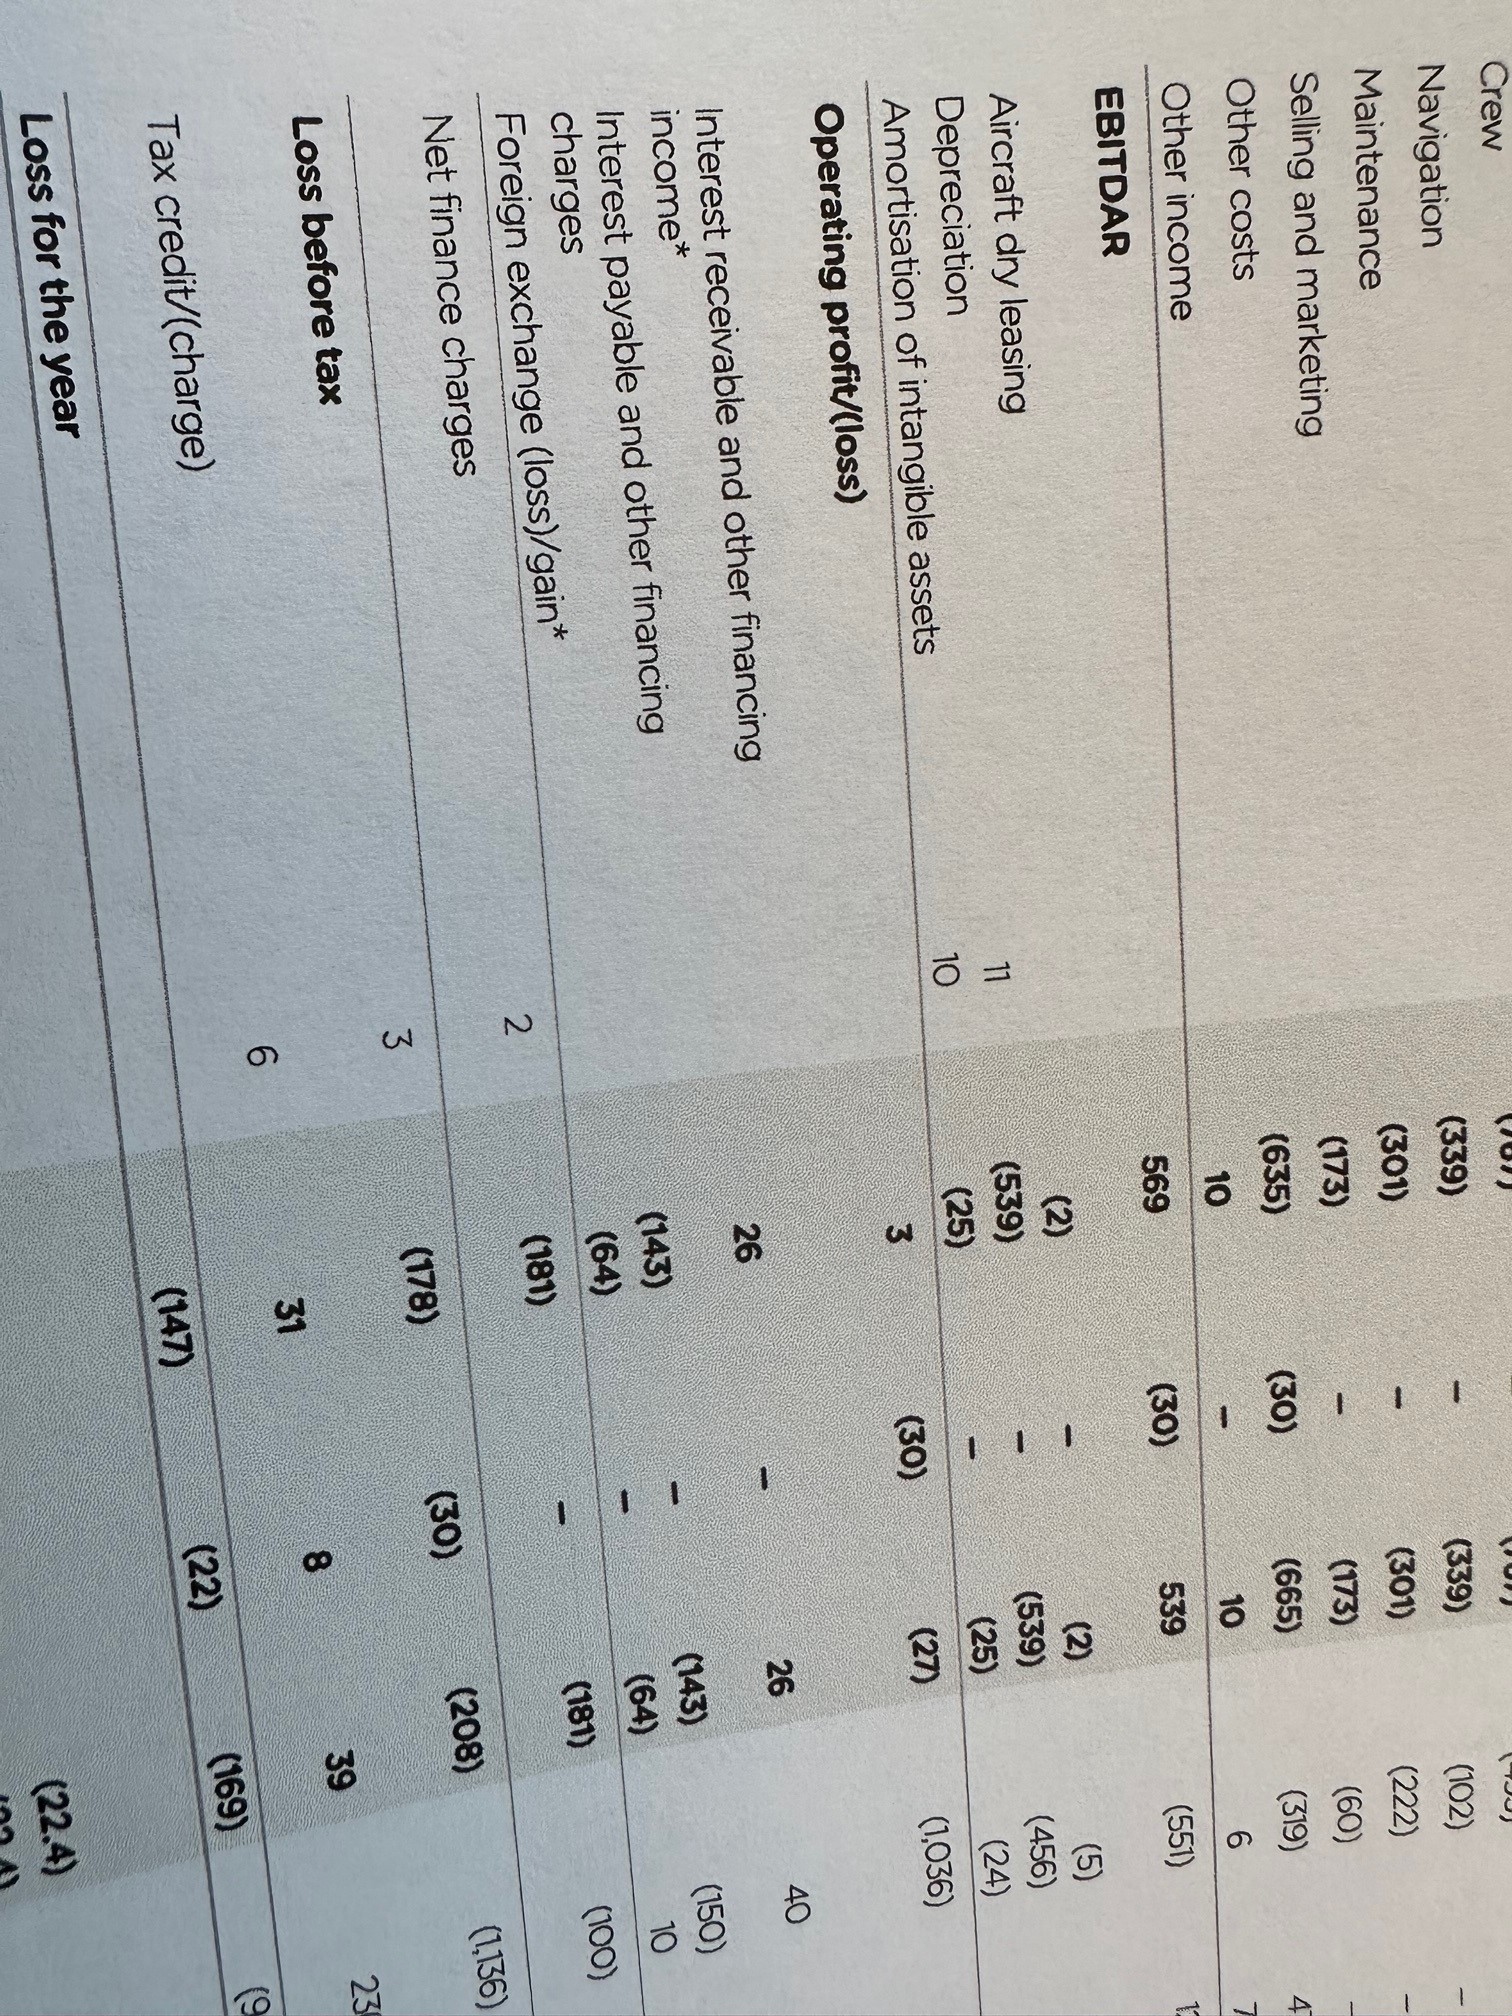
This is calculated by dividing operating profit (some use EBITDA) by the net finance costs. Many lenders have covenants which require operating profit to be maintained as multiple of 3, 4 or maybe 5 times the finance costs.
This has been straightforward in the ‘easy money’ era of low interest rates. But a rise from 0.5% to 3.5% in Bank of England base rates resents a huge increase in finance costs – and a resulting fall in interest cover. If those covenants are triggered, companies could be in default and unsympathetic lenders could cause administration (or Chapter 11 in the US).
One example: EasyJet’s profitability has reduced, and despite some reduction in borrowing they have an operating loss (so no interest cover) and EBITDAR Interest Cover of under 4 times. More interest rate rises will not help.
Extra point: the detail of a loan covenant including interest cover may or may not be found in the detail of their annual report. Its fine looking for it – if it is there!
Stat of the Week – £430,000 – average selling price of a new Rolls Royce motor car in 2022. And they sold over 6,000 of them – a record.
What this does not say: How unequally income is distributed across the world. Amid the talk of a cost-of-living crisis, luxury brands continue to do very well. There has never been as much money in the world as there is today.
Buzzword of the Week – EBITDAR
Definition – Earnings before Interest, Taxes, Depreciation, Amortization, and restructuring or rent costs (EBITDAR) is a non-GAAP tool used to measure a company’s financial performance. Although EBITDAR does not appear on a company’s income statement, it can be calculated using information from the income statement.
EBITDAR gives analysts a view of a company’s core operational performance apart from expenses unrelated to operations, such as taxes, rent, restructuring costs, and non-cash expenses..
.Alternate View – a variation on the more common EBITDA, but removing more irregular costs like restructuring to allow a good view of operational performance. Yet it retains the weaknesses of EBITDA: the company will still have to find the cash to pay the Interest, Tax, and those pesky restructuring costs. Hardly the full picture.