
What we learned this week…
Among the trends in 2020 must be our increased familiarity with data, or at least with people using it. We are all amateur epidemiologists now. Next slide please…
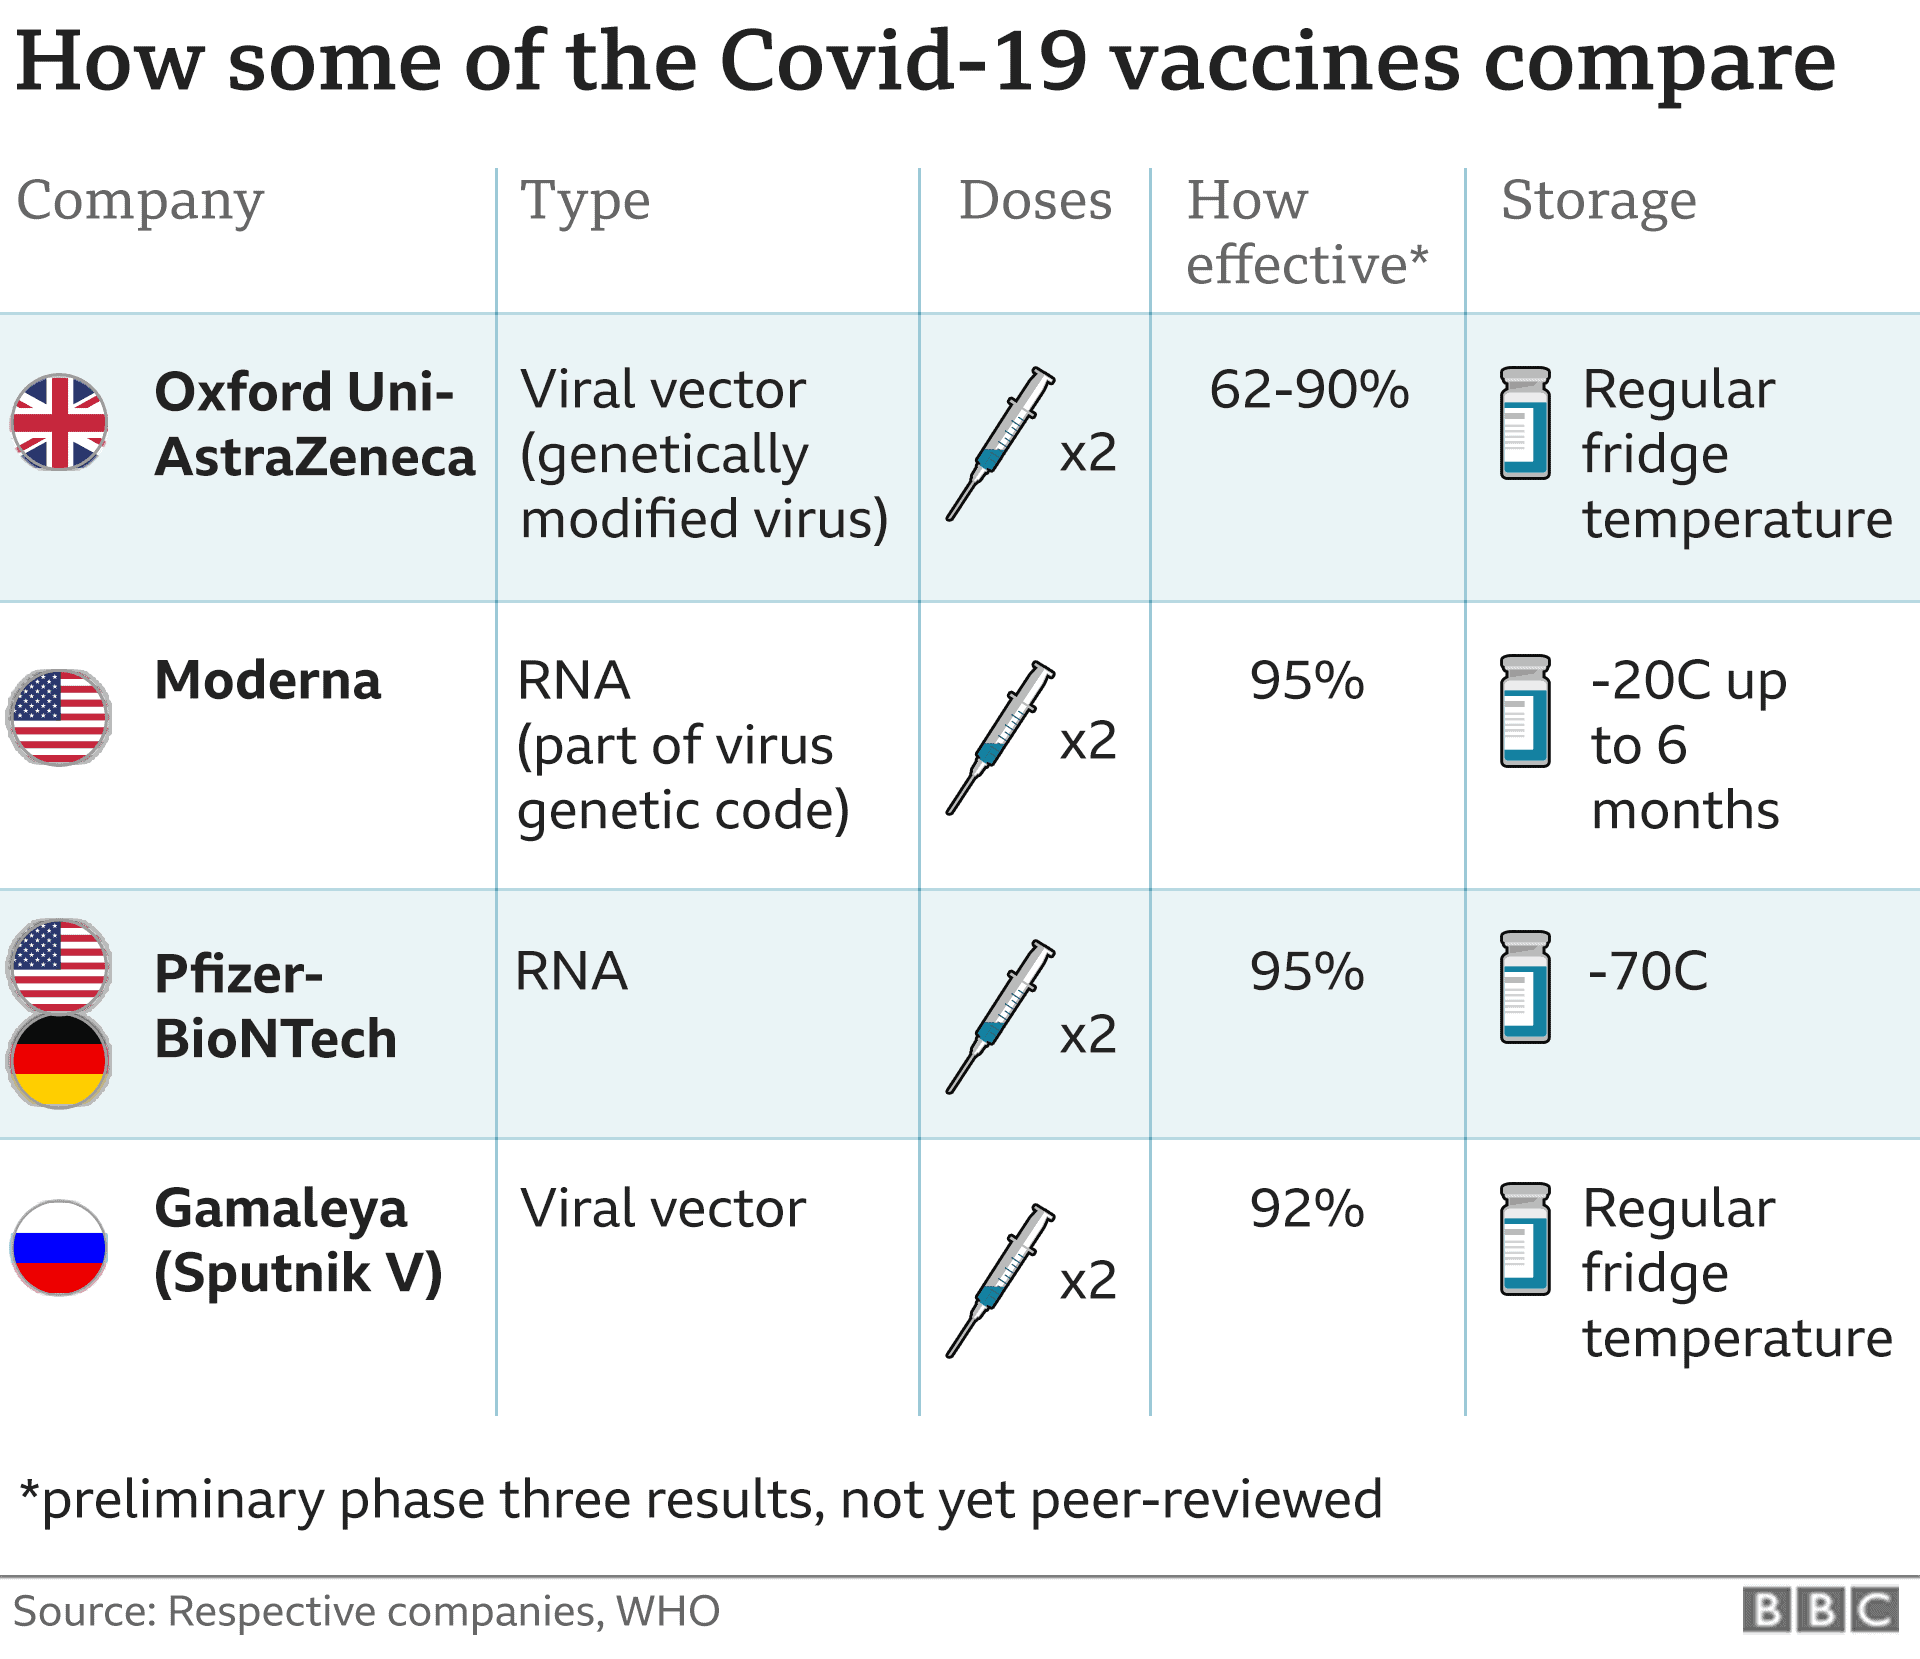
The picture above, taken from the BBC website, using WHO data, is a case in point. This is not an especially complex illustration, or a complex use of data. But it will be used to tell a story, or by people who see it to tell a story to themselves.
This simple comparison chart has its uses, but I believe it can also be a useful illustration to us of wider significance. Because it misses a lot.
In my view, (some of) what is missing here:
• The fact that no one knows how effective these vaccines are yet. The numbers are there, but the footnote shows that these claims have not yet been fully peer reviewed. And we have not yet started widescale vaccination.
• The AZ/Oxford effectiveness looks lower than the others. But around 70% effectiveness is great for a vaccine. The regular flu vaccine is around 50% effective *
• No mention of cost. I have seen several reports of the cost of these, and one suggests Pfizer’s vaccine may be “nearly £30/dose, the AZ/Oxford one either “around a fifth” or £2.23 before discount. (According to the Private Eye magazine columnist “MD” Dr. Phil Hammond). That difference could make a huge difference.
• The storage – there is another huge cost implication, which I have not seen quantified so far. The need for cold supply chains will effect the use of vaccine in developing countries, where simple refrigeration is not ubiquitous as in the “rich world” I live in – and where you live too.
• Vaccines are only effective when they are put into people. Not everyone is keen on the idea of being vaccinated, with a wide range of reasons why they feel like this – not all data related either. In a world of social media, reports have claimed vaccination is a method of governments installing devices to track movement. (I do not believe this myself)
This is not just about 2020 and coronavirus. In finance, people will read financial statements and make views about companies s based on them. “People” here includes me.
Yet financial statements are never the whole story, even when they can give you a clue about what is happening. The collapse of UK company Carillion in 2018 is an example. Look also at what has happened to UK retailer Debenhams. Still, they make good case studies in finance training.
Today you will look at lots of data. Some of that data will be “good”, accurate, and reliable. You may make some judgements based on it.
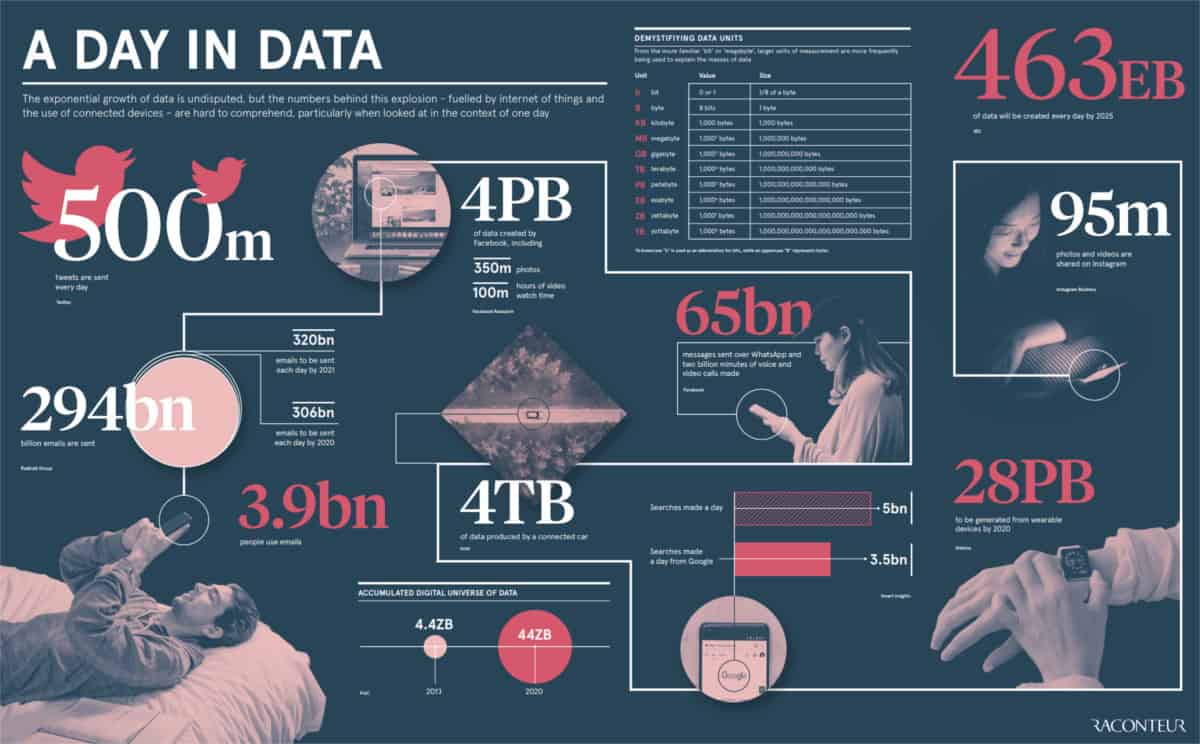
But always ask yourself – what’s missing? Even the grandest spreadsheet will have limitations, if not in its capacity, then in the human capacity to look beyond the immediate numbers.
Which if not to suggest that Phil’s Finance Thoughts is always the whole story. You can still ask – what’s missing?
Source Material:
This link includes the picture with the vaccine data https://www.bbc.co.uk/news/health-55056016
Flu vaccine efficacy – https://www.cdc.gov/flu/vaccines-work/vaccineeffect.htm
This link mentions the conspiracy theory about vaccination: how much time do you have to read this right now? https://www.bbc.co.uk/news/52847648
https://www.private-eye.co.uk/ but you can only read about the vaccine in print.
Buzzword of the Week – Depreciation
Definition – Depreciation is an accounting method of allocating the cost of a tangible or physical asset over its useful life or life expectancy and represents how much of an asset’s value has been used up. Depreciating assets helps companies earn revenue from an asset while expensing a portion of its cost each year the asset is in use. If not taken into account, it can greatly affect profits.
Businesses can depreciate long-term assets for both tax and accounting purposes. For example, companies can take a tax deduction for the cost of the asset, meaning it reduces taxable income. However, most tax authorities insist that when depreciating assets, the cost must spread out over time. Alternate View – This goes way beyond your experience of car ownership. Firstly, in finance we depreciate Tangible assets: intangible assets are amortised. This is where we get the D&A in EBITDA.
More importantly, depreciation is a business expense for tax purposes, but is not a cash outflow. When you sell your car, you do not have to pay the depreciation.
There’s more: there are different methods of depreciating the value of an asset: straight line (fixed amount each year), reducing value(reduce by a percentage, but never get to zero), or depreciate with use, not time (boats & planes & machines). Lots of opportunity for being creative!
Online Learning – my first online programme – How to Read Financial Statements – is now available. This is a series of 7 online lessons:
1. How finance fits with Strategy
2. The Language of finance
3. Owning & Owing – using the Balance Sheet
4. Measuring & Managing Profit
5. Measuring & Managing Liquidity
6. Budgets, what, why & how
7. The most important part of all
Each last between 20 & 40 minutes and includes the slides and videos to help you understand what good looks like in financial terms. There is a special offer price this week of just $49, and is available now at https://app.mastermind.com/masterminds/8443
On Tuesday & Wednesday next week I am training in Cyprus: its actually online but relevant for people in banking across Europe. There is still time to book on The Impact of Digital Technology in banking https://eimf.eu/product/impact-of-digital-technology-in-banking/
Phil Ingle Associates – we get businesspeople to put on their financial underpants over the top of their tights or trousers, to feel more confident, effective and successful. We do this by designing & delivering online and face to face training, speaking and mentoring. I specialise in finance, negotiation, & communication. Can I help you? email me to schedule a call